Grafana dashboards-as-code with grafonnet-lib
Setting up and building Grafana dashboards-as-code with jsonnet and grafonnet-lib


If you ever wanted to manage Grafana dashboards-as-code, not creating and changing them entirely manually, clicking on things in Grafana UI, it might be somewhat challenging to make that happen.
There is a way to manage dashboards outside of Grafana in JSON format, which is used when exporting, importing and also, more recently, provisioning dashboards with Grafana. However, Grafana dashboard JSON data is not the easiest to edit and keep in VCS, so not really the best way to go, if you would like to manage Grafana dashboards-as-code.
Fortunately, there are a few libraries that aim to make this easier, by providing a way to describe the dashboards in a "condensed", more readable and less strict format, than standard JSON. These libraries might also provide a way to generate a valid Grafana dashboard JSON from this description, which can then be imported or provisioned into Grafana.
Notable examples of the more popular libraries for this purpose include:
- grafanalib from WeaveWorks
- grafyaml from OpenStack
- grafana-dash-gen from Uber
- grafonnet-lib from Grafana
In this post we'll look at grafonnet-lib in a bit more detail - how to set it up and how to describe, generate and provision a simple Grafana dashboard with it.
What is Jsonnet and grafonnet-lib?
Jsonnet from Google is required to use grafonnet-lib. Jsonnet "extends" JSON format in a way, by supporting the use of conditionals, variables, functions and other features.
grafonnet-lib is a library, which provides Grafana-specific resources for use in Jsonnet. Both of these tools together allow to describe Grafana dashboards a lot easier and using considerably less text than plain JSON. It uses built-in defaults for describing dashboards, so you only need to provide parameters that are different than the defaults. This saves a lot of lines and effort.
The resulting Jsonnet files are also a lot friendlier for VCS, since they are shorter and the changes are visible more clearly.
It supports most of the built-in plugins and datasources, however, if using some advanced or custom plugins, this might not work out-of-the-box.
How to use grafonnet-lib?
These are the 3 main components required to build a dashboard:
- Jsonnet
- grafonnet-lib
- a .jsonnet file, which includes resources from grafonnet-lib, describing various dashboard resources, for example, panels, template variables and datasources
Readme in grafonnet-lib repo provides information, on how to install Jsonnet and grafonnet-lib. There's also a PR for adding a Dockerfile to make initial setup and testing easier.
How to describe a Grafana dashboard?
Grafana dashboards can be described in one or more .jsonnet files. These files would then be used to generate JSON files for importing into Grafana.
Let's describe a simple dashboard with 3 panels in Jsonnet, using grafonnet-lib. First, let's assign some resources from grafonnet-lib to variables, to make it easier to use them for describing stuff on our dashboard:
local grafana = import 'grafonnet/grafana.libsonnet';
local dashboard = grafana.dashboard;
local template = grafana.template;
local singlestat = grafana.singlestat;
local graphPanel = grafana.graphPanel;
local prometheus = grafana.prometheus;
Next, we can start building the dashboard itself. The flexibility of Jsonnet allows to adapt it to various situations. Some define panels as variables or functions, and then add these to the dashboard. Some define the panels straight into the dashboard resource or describe them in different files, and include them in various dashboards. Since this is example is quite simple and short, we will go the first route - have everything in a single file, define some local variables describing the panels, and then add them to the dashboard object.
Since the grafonnet-lib documentation currently is a bit scarce, looking at the source code can be useful to find out, what are the default values for specific resource types, and what would need to be changed to get the desired result.
Let's define two singlestat, and one graphPanel..panels:
local buildInfo =
singlestat.new(
title='Version',
datasource='Prometheus',
format='none',
valueName='name',
).addTarget(
prometheus.target(
'prometheus_build_info{instance="$instance"}',
legendFormat='{{ version }}',
)
);
local systemLoad =
singlestat.new(
title='5m system load',
datasource='Prometheus',
format='none',
valueName='current',
decimals=2,
sparklineShow=true,
).addTarget(
prometheus.target(
'node_load5{instance="$instance"}',
)
);
local networkTraffic =
graphPanel.new(
title='Network traffic on eth0',
datasource='Prometheus',
linewidth=2,
format='Bps',
aliasColors={
Rx: 'light-green',
Tx: 'light-red',
},
).addTarget(
prometheus.target(
'rate(node_network_receive_bytes_total{instance="$instance",device="eth0"}[1m])',
legendFormat='Rx',
)
).addTarget(
prometheus.target(
'irate(node_network_transmit_bytes_total{instance="$instance",device="eth0"}[1m]) * (-1)',
legendFormat='Tx',
)
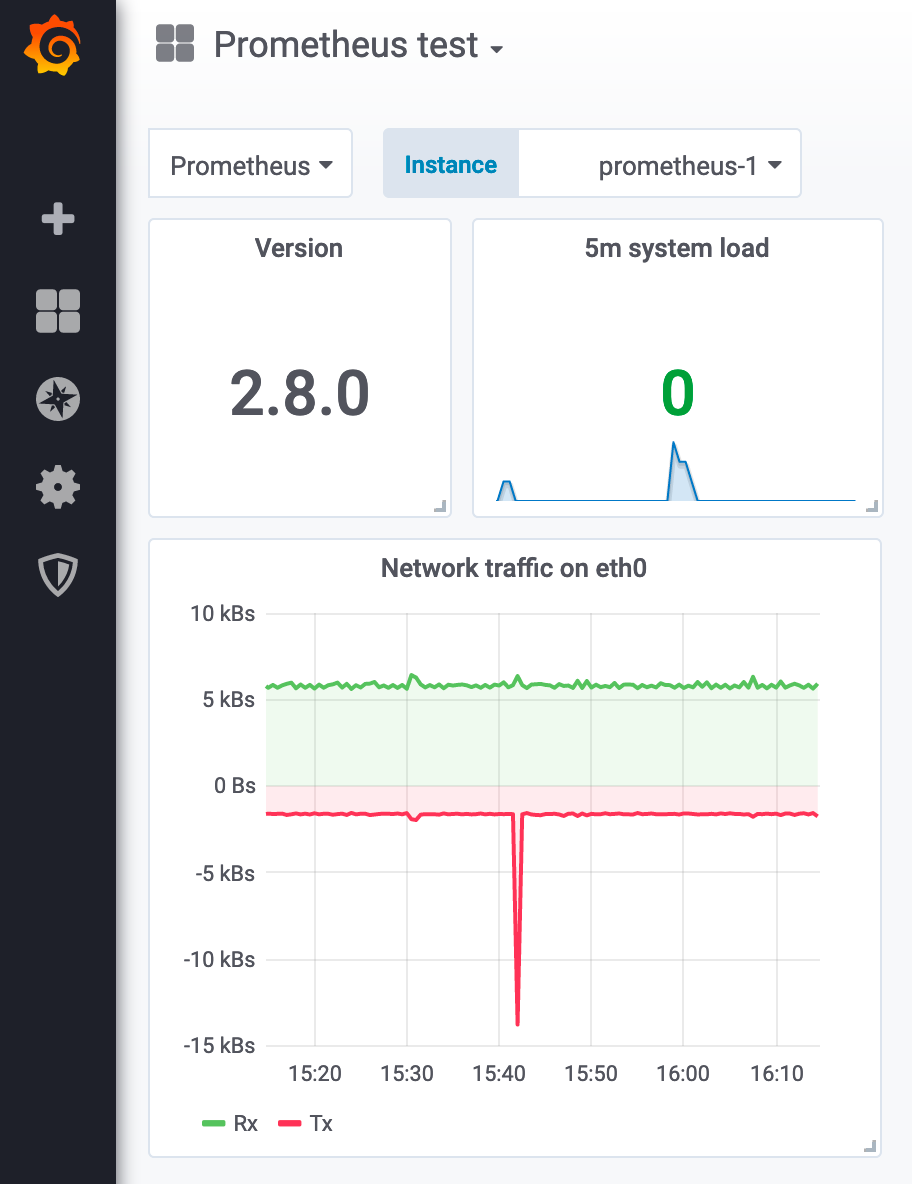
);These would show the Prometheus version, Prometheus instance 5 minute system load and network traffic on eth0 on Prometheus instance, respectively. The $instance is a variable we will define a bit later with a new template variable.
To add these panels to a dashboard, we first create the dashboard object with some basic properties:
dashboard.new(
  'Prometheus test',
  tags=['prometheus'],
  schemaVersion=18,
  editable=true,
  time_from='now-1h',
  refresh='1m',
)
Next, we will add 2 new template variables right below it. The first one will be for the datasource:
.addTemplate(
  template.datasource(
    'PROMETHEUS_DS',
    'prometheus',
    'Prometheus',
    hide='label',
  )
)
This would gather all datasources within Grafana with the type Prometheus, and assign it to $PROMETHEUS_DS for use in the dashboard.
We will add another template variable for a specific Prometheus instance, just in case there is more than 1, to allow us to switch among them:
.addTemplate(
  template.new(
    'instance',
    '$PROMETHEUS_DS',
    'label_values(prometheus_build_info, instance)',
    label='Instance',
    refresh='time',
  )
)
This would assign all instances, which report prometheus_build_info metric in $PROMETHEUS_DS datasource, to an $instance variable we used above in our panel queries.
Finally, let's add the panels we defined previously to the dashboard we have now created:
.addPanels(
  [
    buildInfo { gridPos: { h: 4, w: 3, x: 0, y: 0 }, },
    systemLoad { gridPos: { h: 4, w: 4, x: 3, y: 0 } },
    networkTraffic { gridPos: { h: 8, w: 7, x: 0, y: 4 } },
  ]
)
Here we add all the 3 panels, and also define their position on the Grafana flexible grid, introduced in Grafana version 5.
There are 2 distinct methods for adding panels: addPanel, which adds a single panel, and addPanels, which can add more than 1 panel. Most of the examples and documentation I've seen use only addPanel. It works fine, if there are less than 10 panels on the dashboard, which examples mostly do. When there is a need to add more than that, using addPanel can become a problem, so using addPanels is crucial when building larger dashboards with grafonnet-lib.
That's it - this Jsonnet file can be used to generate the JSON data to be imported into Grafana.
How to generate Grafana dashboards?
Suppose that we saved our dashboard description above into prometheus.jsonnet file. In order to turn it into JSON, we would run:
jsonnet -J /path/to/grafonnet-lib prometheus.jsonnet -o prometheus_compiled.jsonThe -o parameter can be omitted to have the JSON in stdout, if that is more convenient. Anyway - the resulting JSON can be imported into Grafana as a new dashboard:
How to provision Grafana dashboards?
Grafana supports datasource and dashboard provisioning since version 5. It is now possible to define datasources and dashboards as code and keep them in VCS, instead of relying on Grafana API to set them up post-deployment, which required Grafana to be running.
As the documentation states, specific configuration file is required to enable provisioned dashboards. The dashboards to be imported, need to be in JSON format. The workflows of getting those dashboards from a Jsonnet file in VCS into Grafana will depend on infrastructure and constraints. The general principle is that .jsonnet files are kept in VCS instead of JSON files, and converted to JSON only for import into Grafana.
One caveat is that it is not possible to save changes to a provisioned dashboard in Grafana UI. It will need to be saved as a copy or a JSON file locally.
Summary
Jsonnet with grafonnet-lib allows to describe Grafana dashboards-as-code in a more convenient and VCS-friendly way, when compared to plain JSON. The source .jsonnet file described here would be about 90 lines, while the resulting JSON generated by Jsonnet from it would turn out to be around 350 lines long. Together with native dashboard provisioning in Grafana, this enables great improvements in dashboard management, compared to previous Grafana versions and manual work.